If you want to debug something that is build / run with Gradle, you have a few options.
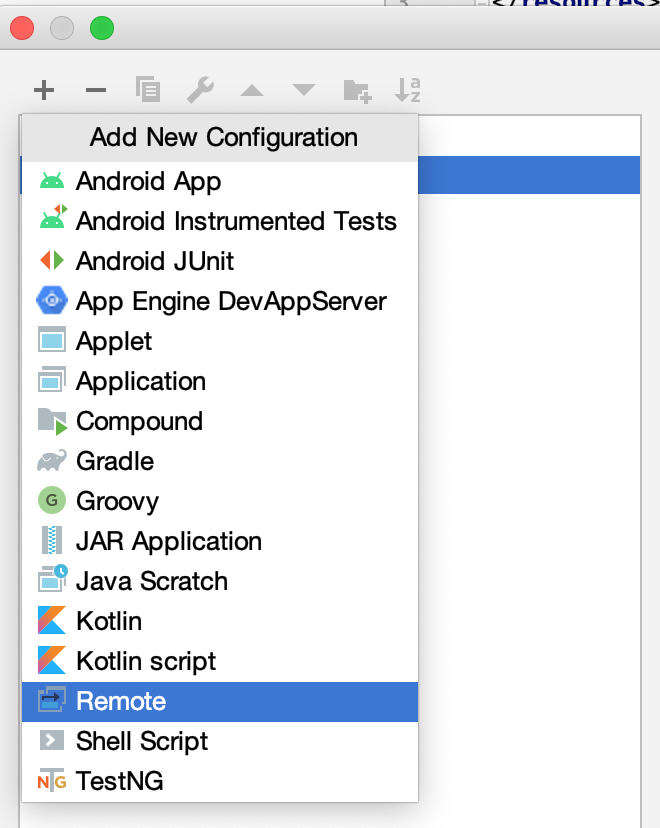
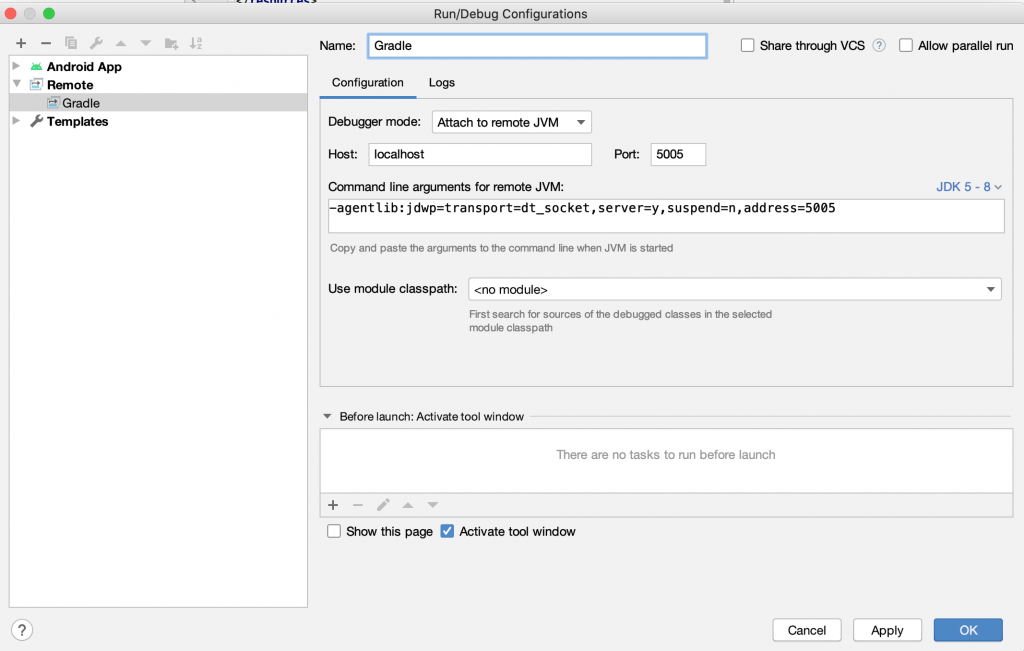
In all cases, your IDE needs to be set up to listen to a remote JDWP (Java Debug Wire Protocol) connection. In IntelliJ this looks like this: Go to “Edit configurations”, hit the “+” button on the top left corner, select “Remote” and give your run configuration a name. Leave the other configuration options as-is. (As Gradle will always start the debug server for us, we leave “Attach to remote JVM” selected.) Finally, hit “OK”.
Now to the actual debugging.
Debugging JUnit tests
More often than not you cannot debug a unit test properly inside the IDE. Even if you use the Gradle builder in IntelliJ for example there are times where the IDE simply won’t get the classpath right and your tests fail with obscure errors.
Now with Gradle we don’t need to start the tests from within the IDE to debug them, luckily! All we need is this:
./gradlew app:testDebug --tests MyAwesomeTest --debug-jvm
This is an example from an Android project, but you can think of any other test flavor here. With --tests we define the test we’d like to run (to avoid having to wait for all tests of the module to be executed) and --debug-jvm lets Gradle wait for our debugger to attach, before the test is executed.
Now you can put breakpoints into your code and start the pre-configured “Gradle” run configuration in “Debug” mode. As soon as you see “… connected” in the IDE, the command line execution will continue, execute your test and eventually stop on your breakpoints.
Debugging Gradle build scripts
Debugging Gradle build scripts itself is possible by starting any Gradle command with an additional, slightly different argument:
./gradlew myAwesomeTask -Dorg.gradle.debug=true
Here again, Gradle will start up and wait for your IDE to connect to the debug server, then continue executing your task and eventually stop on your breakpoints.
I can’t connect to my debugger!
If you run your debugger on a different server or inside a Docker container, ensure that you open the debug server for all ports, not just localhost, which is the default, by adding
-Dorg.gradle.debug.host=*or by configuring it for your test execution like this:
tasks.withType<Test> {
    debugOptions.host.set("*")
}
Not so fast, my breakpoints are not hit!
Well, it wouldn’t be Gradle if it would be that easy, right? Right!
Issue is that in a “properly” configured Gradle project there are probably multiple things set up to speed up your build. First and foremost, a running Gradle Daemon in the background might be re-used and you might fail to attach to that Daemon again once you disconnected from it once. So, best option here is to disable the usage of a global daemon for your run and just spawn a specific daemon for the command you want to debug:
./gradlew --no-daemon ...
(There is also an org.gradle.daemon.debug option to debug the daemon itself, but I never found a useful way of working with this. Would be helpful for feedback on this one :))
Secondly, you might have a build cache set up (either locally or remote). If you run tasks that ran through successful once, Gradle will just use the default outputs and skip task execution completely. (You’ll notice that usually when the Gradle output says something like “x tasks executed, y tasks cached, …”.) So, disable caching temporarily as well:
./gradlew --no-daemon --no-build-cache ...
Lastly, specifically if you execute tests, you should remove the previous test results, so your test is actually executed again:
rm -rf app/build/reports && \
  ./gradlew --no-daemon --no-build-cache ...
Now your breakpoints should be hit for real. Happy debugging!
Instead of running
rm -rf app/build/reportsyou can add--rerun-taskswhich enforces task rerun in Gradle and I think also rerun a test.That’s right, however, this would also re-run all dependent tasks, which is usually unneccessary (see https://docs.gradle.org/current/userguide/command_line_interface.html#sec:rerun_tasks), so I developed a habit to just manually clear the test task’s build artifacts and keep the rest around for quicker cycles.